Table of Contents
Step 1 | An Introduction to Developing a Volunteer Water Monitoring Program
Step 2 | Setting Goals and Objectives
Step 3 | Understanding Elements of Quality Assurance (QA) and Quality Control (QC) Protocols
Step 4 | Recruiting, Training, and Retaining Volunteers
Step 5 | Collecting Reliable Data
Step 6 | Data Collection, Analysis and Data Management
Step 7 | Evaluating the Success of Your Program
Additional Resources
|
Step 6 | Data Collection, Analysis and Data ManagementAfter completing this step, you should be able to:
This step will discuss preparation for collecting your samples and considerations after volunteers have collected the data. After reading this portion, you should be able to articulate some important components for collecting samples and managing your data. 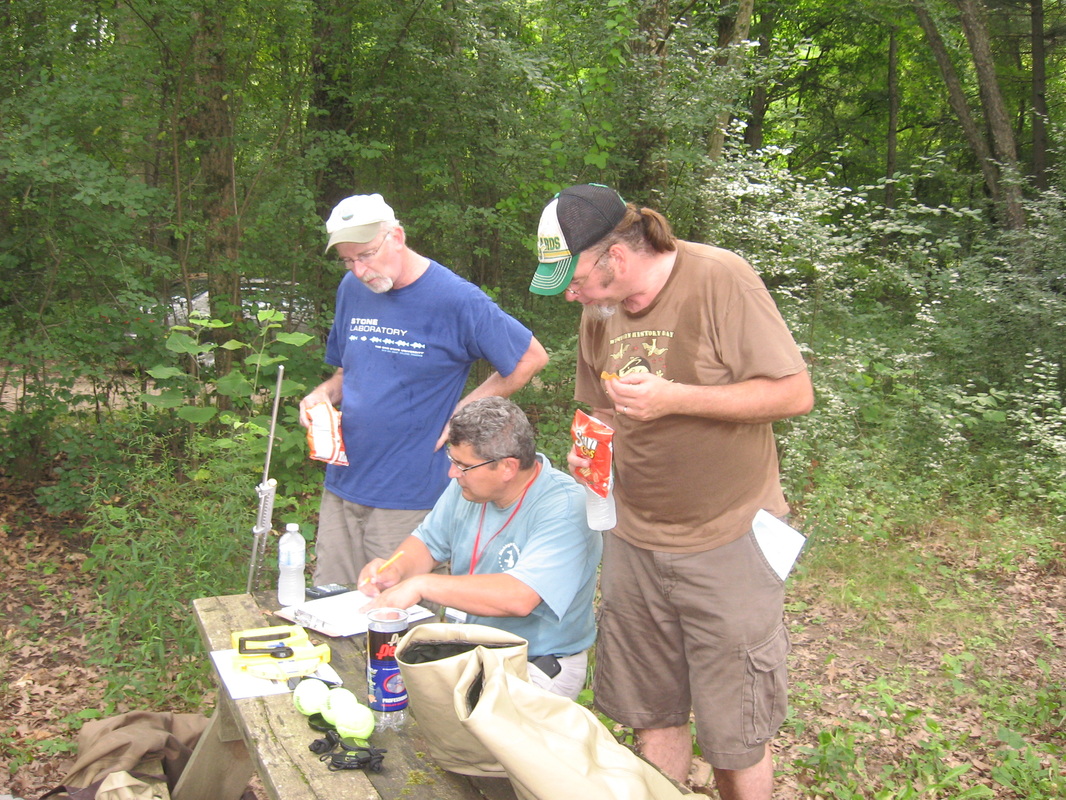
Introduction
In the last step, you learned that you should match your goals for the study with various aspects of your sampling planning and answer a number of questions about the data collection effort. It is important to review who will be using the data. Once the data are collected volunteers need to know how the data will be analyzed, stored, interpreted, and how it will be presented. One component of Quality Assurance is making sure that you talk with your volunteers about the value and importance of accurate data. Thus, as previously mentioned, prior to going out to the field to collect data, volunteers should be required to attend one or more training sessions that discuss general data collection techniques and the parameters that may be included in the program. Volunteers should be shown how to measure parameters or identify organisms and be given hands-on opportunities for using the various equipment and manuals associated with the parameters of interest. Data sheets and reference materials including manuals, identification keys, or general fact sheets should also be available to all volunteers. A question and answer period will help volunteers address specific issues within their targeted area. It is a good idea to use accepted scientific methods when determining the protocols that will be used for the various parameters to be measured. Protocols that will be used should be distributed in a written format to all volunteers or be available via a web site or library. There are numerous protocols for collecting data, some of which depend on the type of data you may be collecting. For example, is it chemical, physical or biological data? If you’re collecting a lake sample, your protocol for a particular parameter will likely be different then if you’re taking a stream sample. Measuring dissolved oxygen from a lake may require several samples at the same location but at various depths, whereas the samples from a stream may be at the same depth but across the stream channel. Whether you use an inexpensive kit or costly meter must also be considered. Once again, you and your volunteers need to revisit your goals and talk with your steering or technical committee to determine how accurate your measurements need to be and who will be using the data. While this module will not attempt to address the wide variety of sampling protocols that could be used in a volunteer monitoring program or step by step approaches for monitoring a specific parameter, references at the end of the module will include several documents that discuss sampling protocols for a variety of parameters. Safety Considerations
Prior to leaving for the field, volunteers should review an equipment and supply checklist of items needed. The selection of the site may be predetermined by looking at topographic maps or online maps that provide latitude/longitude or other location information. Safety is always a key consideration. It is advisable to carry a cell phone, work in groups of two or more, let others know where you will be, dress for conditions, follow rules and regulations, get permission to access water bodies, if needed, and take precautions when necessary. Volunteers should also have access to safety gear, if needed. In th field, volunteers should be aware of steep or eroding banks, poison ivy or other plants that sting or prick, and weather conditions, such as heavy storms. Stream flow, for example, can dramatically increase over a short time span during heavy rainfalls, and conditions can turn dangerous. Your program should have rules in place that indicate when conditions are too risky to sample. Even during normal flow, once volunteers enter a stream or lake they should be cognizant of deep holes, fast moving water, large rocks and slippery spots. If sampling in polluted waters, volunteers should understand potential health risks from contact with the water. 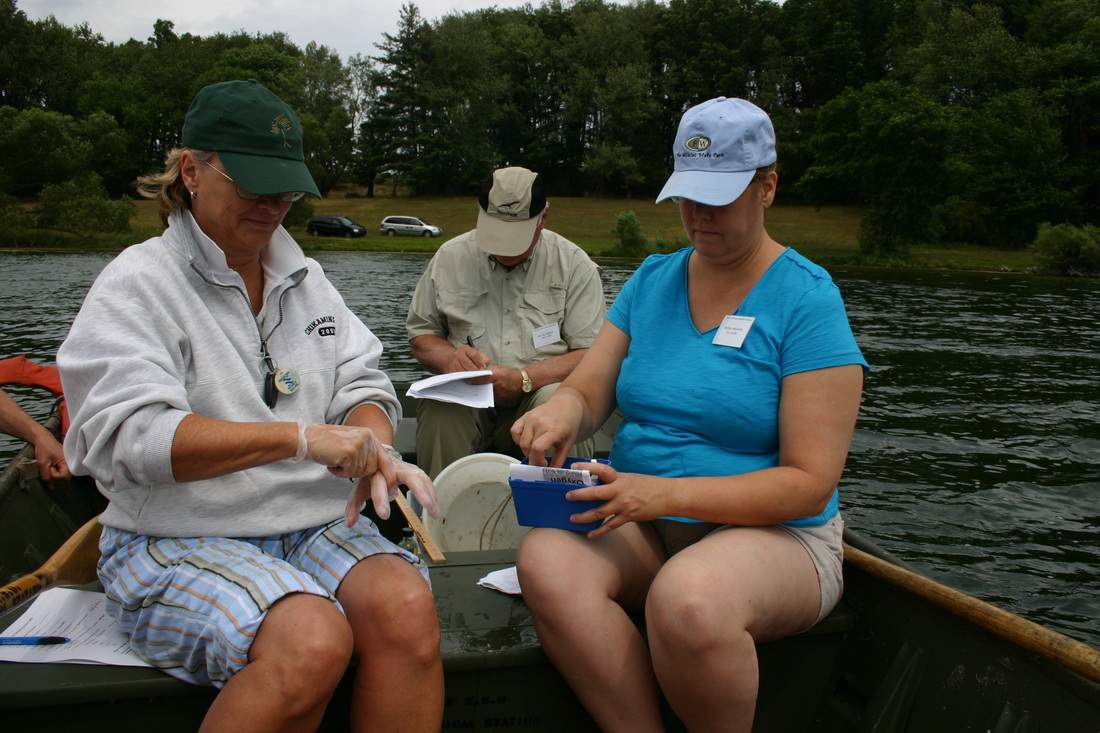
Collecting Your Samples
During any collection effort, volunteers should record information about the site as well as what they are collecting. Forms may include a data sheet and/or a site description sheet. Several sample data sheets for stream monitoring are available from EPA and from volunteer programs, such as the MiCorps program. Some of these are fairly detailed, and you may or may not need to include all the information listed. Taking photographs or making audio recordings may also be useful when you’re later reviewing the data results. Obtaining the latitude/longitude will ensure that the original collector or another volunteer can obtain samples at the same location. Some samples, such as dissolved oxygen concentration or pH, require immediate analyses, and the results should be recorded on the data sheets while still in the field. If samples are to be taken back to a lab for analysis or identification of species, volunteers should make sure that collection bottles or packs are labeled using a pencil or indelible marker, with appropriate information such as site location, date, collector, and any other pertinent information such as replicate number or sample location. They should also make sure that the sample is preserved properly, if required. If the sample needs refrigeration, it should be placed in an appropriate cooler until it gets to its final destination. 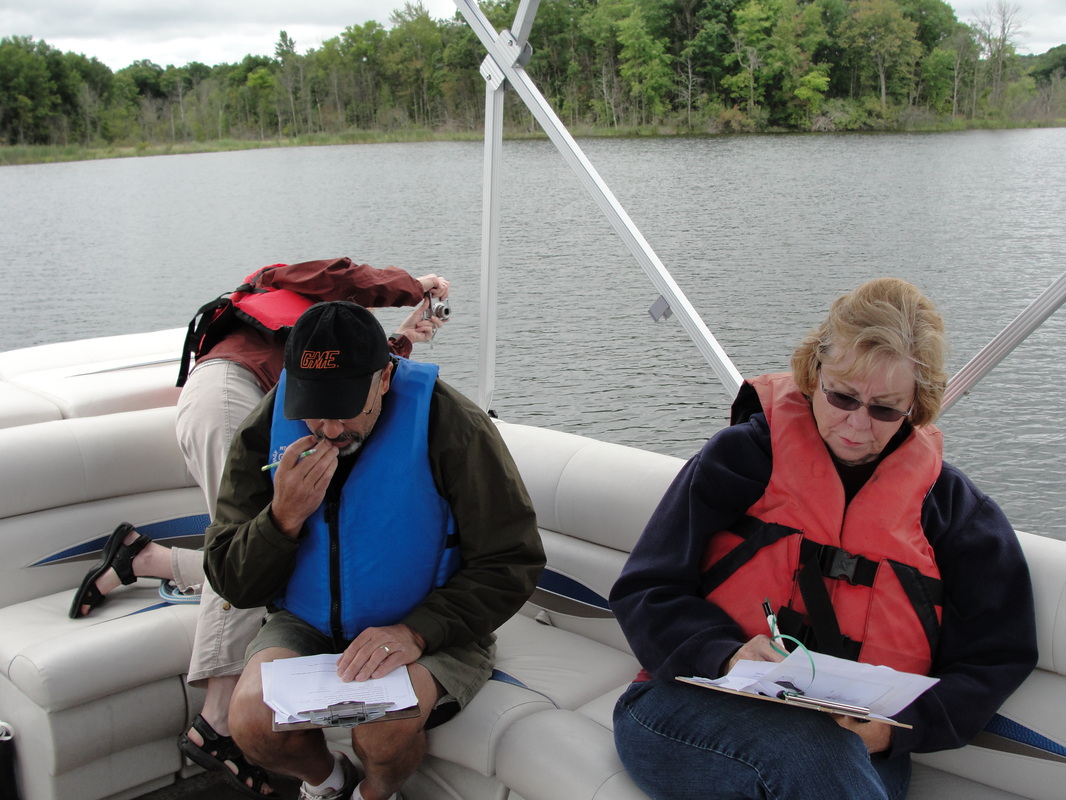
Chain of Custody
During any collection effort, volunteers should understand and have previously been introduced to the concept of Chain of Custody. The Chain of Custody involves keeping good documentation of the data from the time the sample is first collected through its handling, analysis, data input and storage to the final place it resides or until its usefulness has ceased. While a Chain of Custody is crucial in court cases involving disputes, it can also be useful in validating a sample in question. 
Analyses and Data Management
A well thought out data management plan should be an integral part of your volunteer monitoring program. You and your volunteers should know what will be done with the data once it is collected. After the volunteers return to their home site, they may need to perform chemical analyses or identification of species, mail the sample to a lab, give it to another person designated to do the analyses, or upload processed data to a web site, spreadsheet or database. In some cases samples being analyzed by more than one party are split and part of the sample is sent to a lab while the rest remains with the volunteer. Having more than one reading on the same sample provides increased quality control. If samples do not compare with one another, then follow-up actions could include repeating the measurement or returning to the field to obtain another sample. Your written documentation or QA/QC plan should indicate the percent of variability allowed among samples. Once samples have been analyzed by the methods designated in the training sessions or within your QAPP, your volunteers or a designate should enter the data in a computer data management application or something similar such as a database or spreadsheet program. Most spreadsheet packages also have capabilities for making graphs and charts and statistical capabilities for analyzing the data. The sooner you or your volunteers enter the data after collection and processing, the less chance there is for errors or lost data. Many state programs have a centralized data system where volunteers can enter their data allowing the sharing of data across the state or region. In some cases, it is helpful if the data input screen looks similar to the data sheet that the volunteer used in the field to help minimize entry errors and putting data in the wrong field. The next step is validating and verifying the entries. Often this step is done by someone other than the person entering the data. The entered data must be checked against the field and lab sheets to assure that it has been entered correctly, that it is complete, and that it is reasonable. The person validating the data should check to make sure units are correct, decimals are in the right place, and that missing data fields are left blank, rather than filled in with zeros. In cases where the equipment or test is not sensitive enough to get a reading, volunteers should be informed as to whether to add a “less than” symbol, write out the word itself or use the letters ND to indicate “non-detectable”. Consistency in data entry may be helpful, may save time later on and minimize future errors. It is also a good idea to back up the data on another computer.
At some point after the sample data are entered into the data management system, the data may be analyzed. There are many options for analysis, including both observational and statistical. If the data are put into a form that allows you to view them as a whole, it will be easier to examine relationships, either visually or by generating simple statistics, tables, and graphs. Summary statistics further explain the raw data. Some simple statistics such as mean (average), range, and standard deviation might help you compare larger data sets. If, for example, you have multiple measurements for fecal coliform colonies, it may be difficult to determine how water quality differs between two locations just by looking at the raw numbers. By calculating the mean value at each location you end up with only two numbers to compare, and it becomes easier to make initial conclusions about the water quality. However, mean values don’t tell you anything about how the values within one data set varied. Adding the standard deviation provides more information on the variability of the data (Table 1.) More rigorous statistical analyses using t-tests or analysis of variance may be needed to further analyze your data. 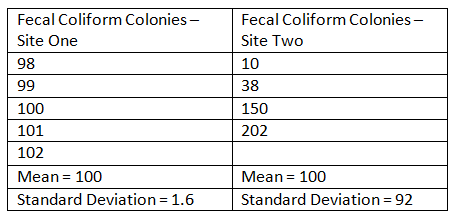
Table 1. Comparing mean and standard deviation of fecal coliform colonies for two stream sites.
After the data has been analyzed, there are multiple ways to interpret it, and make sense of what was collected and analyzed. This step involves asking questions about your data that relate to your original goals and study. You may need to compare your data to a known value or a set of values that can help you answer questions that your group originally posed. If your original goal was to determine the health of a lake or stream, you might compare the new data with a previous year’s reading, against a five year average, or against another site. If volunteers took photos, they can compare them with older or archived photos to look for changes in land uses, infrastructure or other features. You and your volunteers can also make comparisons with known standards or indices that provide some reference such as your state’s numeric water quality standards. Even without statistical analyses you might see trends in the data or particular sites that are always above water quality standards. With the information that you now have, you can present your findings, develop recommendations, prepare presentations or reports, or archive the data until there is sufficient data to make conclusions. In all cases, the data should be backed up, either as hard copy or on another computer.
|
- Home
-
Steps
- Step 1 | An Introduction to Developing a Volunteer Monitoring Program
- Step 2 | Setting Goals and Objectives
- Step 3 | Understanding Elements of Quality Assurance (QA) and Quality Control (QC) Protocols
- Step 4 | Recruiting, Training and Retaining Volunteers
- Step 5 | Collecting Reliable Data
- Step 6 | Data Collection, Analysis and Data Management
- Step 7 | Evaluating the Success of Your Program
- Acknowledgements
